
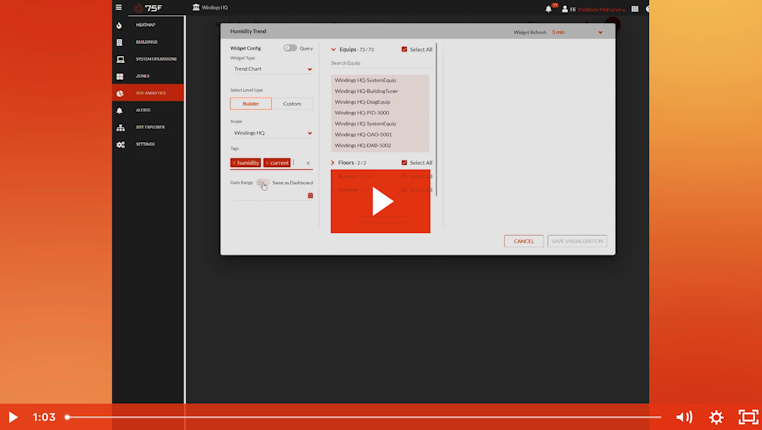
75 Seconds or Less: Creating a Humidity Trend Graph
Tracking real-time energy, comfort, and air quality data across a building or portfolio has never been easier than it is with an IoT-based Building Management System (BMS) user platform. In this video tutorial, we teach 75F® Facilisight™ users how to quickly create trend charts that help them view and compare data like humidity over time.
The 75 Seconds or Less series is an educational guide to leveraging 75F's cloud-based user portal. Check out some of the other lessons:


Healthier Buildings Series: Real Estate Strategies in Times of Uncertainty
Commercial real estate is in a completely different landscape today than it was 12 months ago.

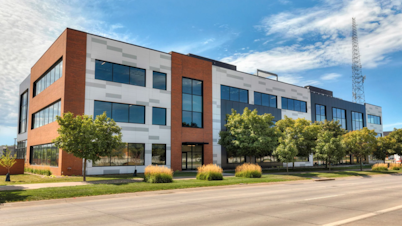
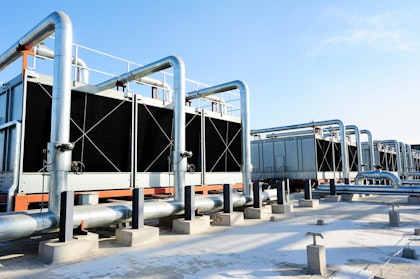
75F Makes IntelliPak RTU Integration Simple in High-End Office Space
Hubbell Realty installed 75F's IoT Building Management System with goals to set a flexible foundation for future building upgrades.