
75 Seconds or Less: Comparing Energy Use to Outside Temperature
75F's IoT-based Building Management System (BMS) collects millions of data points per 50,000 square feet every day. From day one, this information is squeaky clean, tagged, and cloud connected, giving BMS users unprecedented access and control over the information their building systems generate.
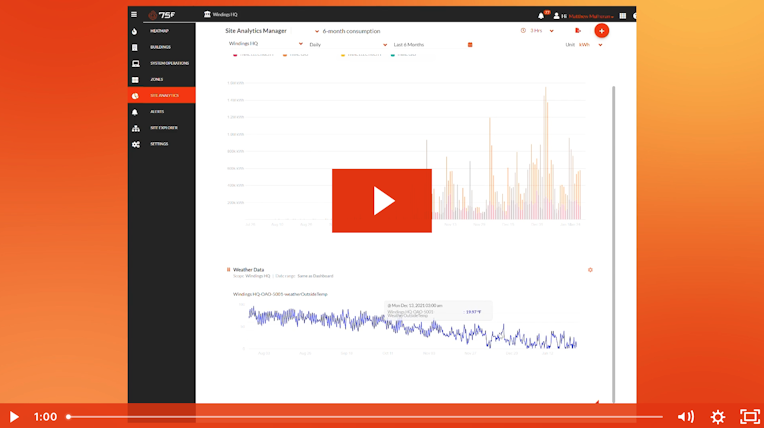
Our user portal, Facilisight, comes pre-packed with powerful visualizations that can add context to this data and help facility managers better understand their buildings' relationship with energy and air quality. However, Facilisight also allows users to create their own analytics to visualize any data points available through the 75F system with ease.
In this example, we demonstrate how to create custom visualizations that compare energy use with outside air temperatures.


Healthier Buildings Series: Real Estate Strategies in Times of Uncertainty
Commercial real estate is in a completely different landscape today than it was 12 months ago.

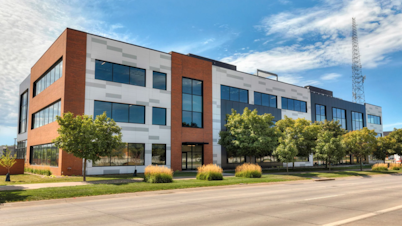
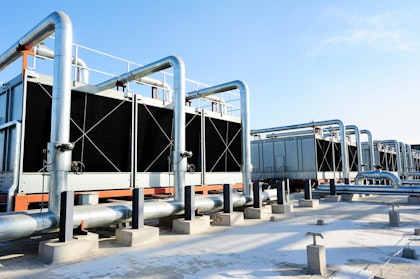
75F Makes IntelliPak RTU Integration Simple in High-End Office Space
Hubbell Realty installed 75F's IoT Building Management System with goals to set a flexible foundation for future building upgrades.