
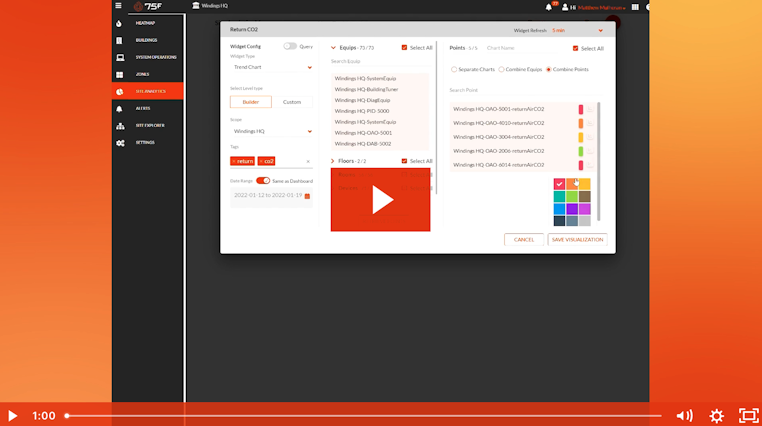
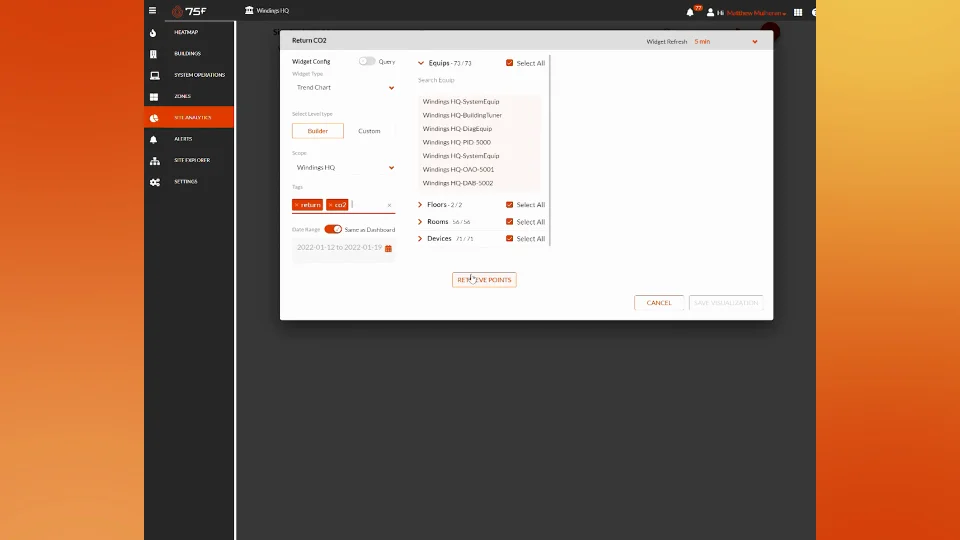
75 Seconds or Less: How to Create a CO₂ Trend Graph
Tracking indoor air quality (IAQ) indicators across a building or portfolio has never been easier than it is with an IoT-based Building Management System (BMS) user platform. In this video tutorial, we teach 75F® Facilisight™ users how to quickly create trend charts that help them view and compare data like CO₂ over time.
The 75 Seconds or Less series is an educational guide to leveraging 75F's cloud-based user portal. Check out some of the other lessons:


Healthier Buildings Series: Real Estate Strategies in Times of Uncertainty
Commercial real estate is in a completely different landscape today than it was 12 months ago.

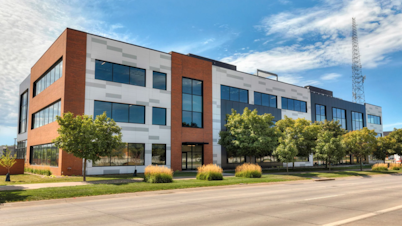
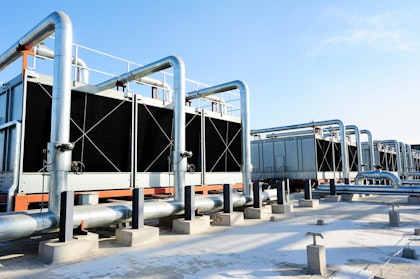
75F Makes IntelliPak RTU Integration Simple in High-End Office Space
Hubbell Realty installed 75F's IoT Building Management System with goals to set a flexible foundation for future building upgrades.