
Time & Motion: AHU Programming & Interface Creation
Some things just take time. 75F doesn't believe AHU programming is one of those things.
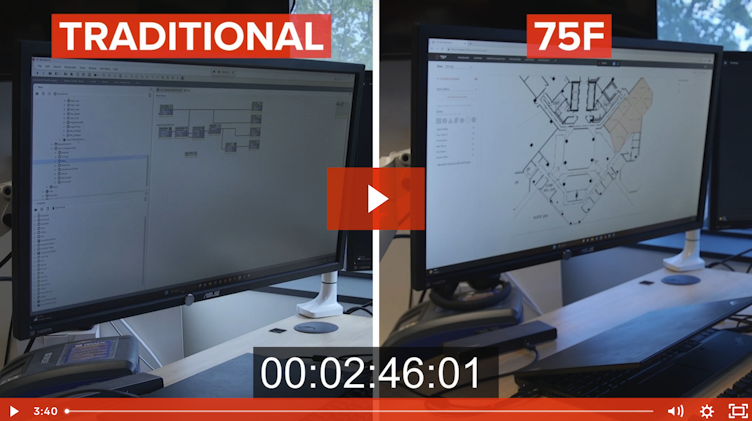
In our last Time & Motion video we showed viewers how 75F's IoT-based Building Management System (BMS) differs from traditional controls solutions at the zone level. Now, we're taking it to the system level. In this video, we square off against a traditional solution at the AHU programming and interface creation step of a building controls installation.
Our expert in this video is Joe Pattenaude, Director of Support Operations at 75F. Joe has more than 14 years of hands-on experience with building controls and carries Niagara 4 Technical and Advanced Technical certifications. We firmly believe what would take Joe hours to accomplish with a different solution really only requires 15 minutes of his time. Watch to see if we're right.
Traditional Controls: 3 Hours, 2 Minutes
Traditionally, this segment of an installation process requires laborious time at a computer linking various points, creating sequences, building floorplans and graphics, and more. Let’s take a look at the step-by-step task list required to reach a minimum viable programmed AHU and interface setup in a traditional controls solution.
An important note: Most of the time, an installer would begin this process by adding and configuring trending for all physical points and configuring alarms. For the purpose of time management, we skipped this step. Alone, this takes hours to complete. That in mind, here’s what Joe did for the traditional approach:
Link all logical points to the correct physical points. 9 minutes.
Link current temperatures, humidity, CO₂, and zone points to create zone averages. 14 minutes.
Link occupancy state from each zone. 6 minutes.
Link duct static pressure and supply air temperature requests for reset logic, and build the sequence. 26 minutes.
Create occupancy schedule, link to all zones and AHU. 3 minutes.
Create px graphics for VAVs. 25 minutes.
Create px graphics for AHU. 32 minutes.
Create floor plan and place zones in correct location. 40 minutes.
Add history extension to all points. 18 minutes.
Build nav file. 9 minutes.
Looking at these steps, it's clear that graphics, floor plans, and sequences eat up the most significant amount of time. Now, let's compare this process with the IoT approach to AHU programming and interface creation.
75F: 14 Minutes
It might be hard to conceptualize how 75F breaks down three hours of work into 14 minutes. Because 75F's engineers did all the hard work upfront, our control sequences are pre-programmed to work out of the box for the most common equipment found in commercial buildings. This includes the AHU we're looking at for this project.
Here's what it takes for 75F to accomplish this phase of an installation:
Select the system profile on the 75F Central Control Unit. Under 1 minute.
Log into 75F Facilisight and upload a floor plan. Drag and drop zones. 13 minutes.
Add a building schedule. 1 minute.
These three straightforward steps highlight a multitude of differences between an IoT-based BMS and other controls systems. In the traditional scenario, zone-to-AHU optimization programming is written by the programmer, while 75F's sequences are pre-written to meet ASHRAE Guideline 36 automatically. Where traditional controls require every trend to be custom created, trends are inherent in the 75F system already and don't require a hard drive because they're hosted in the cloud. Instead of remotely logging into a Jace directly, 75F is more secure by only requiring a Facilisight login.
And remember, Joe used three hours and two minutes to reach a minimum-viable point in the programming and interface creation stage. This table illustrates the limitations or items not performed in this example and compares them to features already included in 75F's 14-minute process.
| Traditional Controls, Items Not Performed |
Features Inherent to 75F |
| Less points on RTU and zones | Much more data from RTUs and zones |
| Points for system tuning were not exposed or added to the user interface | Tuners are adjustable and automatically part of the solution |
| Desired temps were not added to the floor plan | Desired temps are displayed on zones by default |
| Data summaries were not built | Data summaries automatically built |
| Ability to create custom zone desired temps via time schedule was not set up | Desired temps are part of the schedule |
| Floor plan heatmap zone colors were built based on static values | Floor plan heatmap zone colors are based on actual desired temperatures |
| Ability for end users to modify heatmap or zone graphics were not set up | Floor plan / heatmap may be adjusted or changed by end users |
| Layers identifying zone controller status and/or additional data such as schedule type, occupancy status, etc were not built | Layers identifying different data on the heatmap are automatically built |
| Alarms not set up | Alerts are native and require no setup |
| Ontology / site hierarchy not built | Ontology is native to the system and requires no setup |
| Local operator workstation is typically installed so the facility can have control/visibility of the building without an Internet connection. .This was not done in this example. | 75F Central Control Unit acts as the local interface when Internet connectivity is lost. This requires no custom setup or expensive PC / server |


Healthier Buildings Series: Real Estate Strategies in Times of Uncertainty
Commercial real estate is in a completely different landscape today than it was 12 months ago.

75F Makes IntelliPak RTU Integration Simple in High-End Office Space
Hubbell Realty installed 75F's IoT Building Management System with goals to set a flexible foundation for future building upgrades.